Data visualization has, for years, been one of the most powerful tools for transforming information into actionable knowledge. At Blautic, we work precisely at that intersection between data, technology, and real organizational value. Our approach does not start with the question “which technology is the most striking?”, but rather “which problem do we want to understand better, and how can data help us do so?”
In this context, augmented reality emerges as a natural evolution worth strategic reflection, especially for companies that already manage large volumes of information.
1. What data visualization is and how it interacts with augmented reality
When we ask what data visualization is, we are referring to the process of representing complex information graphically in order to make it easier to understand. From executive dashboards to advanced interactive environments, the goal is always the same: identify patterns, anticipate scenarios, and improve decision-making.
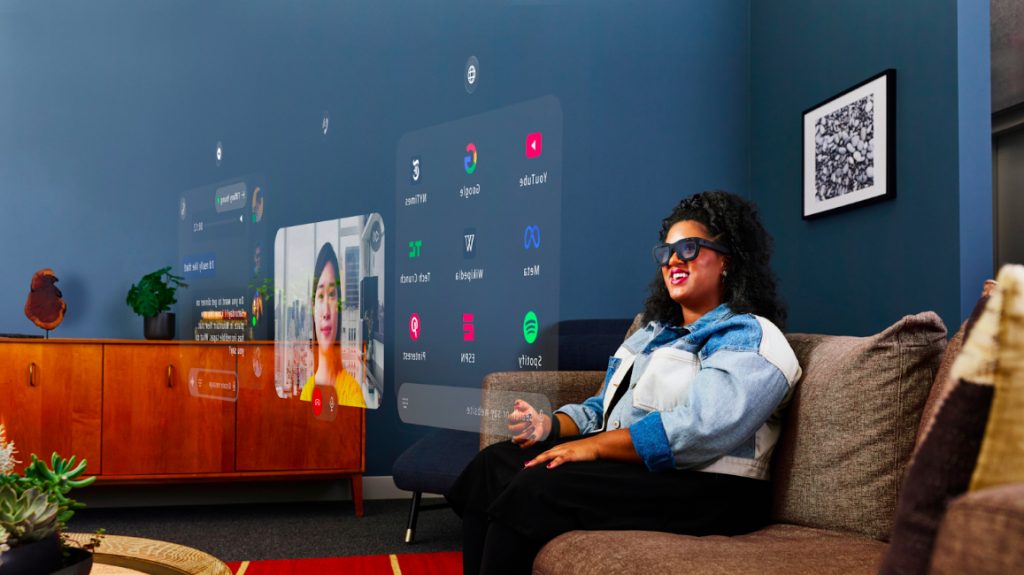
Traditionally, this data is displayed in environments separate from the physical space where processes take place. We analyze figures on a screen and then act. Augmented reality introduces a different possibility: integrating information directly into the real environment by overlaying digital layers onto objects, spaces, or people.
More than an aesthetic shift, this represents a change in our relationship with data. Information can become contextual, appear when it is relevant, and adapt to the user’s position or activity.
2. Data visualization systems integrated with augmented reality
For this integration to make sense, an attractive interface is not enough. It requires data visualization systems capable of connecting with existing infrastructures: sensors, analytics platforms, corporate databases, or artificial intelligence solutions.
From a business perspective, this means rethinking technological architecture. Visualization stops being the final layer of the process and becomes part of the operational flow itself.
Imagine industrial environments where performance metrics are displayed directly on machinery, or training processes where instructions appear integrated into the physical space. Much of this data already exists; the difference lies in how it is presented and at what moment.
These kinds of scenarios require addressing issues such as latency, security, data governance, and user experience. It is not just a technical challenge, but an organizational one as well.
3. Data visualization tools and software
Current data visualization tools and data visualization software have advanced enormously in capability and sophistication. There are powerful solutions for descriptive, predictive, and even prescriptive analytics.

However, most of them are designed for two-dimensional environments. If visualization evolves toward spatial formats, technologies, design methodologies, and usability criteria will also need to adapt.
At Blautic, when we approach data projects, we focus on clarity, visual coherence, and practical usefulness. Technology matters, but the narrative we build with it matters more. An effective visualization system is not the one that displays the most metrics, but the one that helps people better understand what is happening and why.
Potential integration with augmented environments also requires a more selective design approach: prioritizing critical information and avoiding cognitive overload.
4. The limits of data visualization screens
Traditional data visualization screens will continue to be essential in many contexts. They are efficient, accessible, and deeply embedded in corporate culture.
Nevertheless, they have clear limitations. They require separating analysis from the physical context and can make it harder to understand complex spatial relationships. In dynamic environments, that separation can generate small frictions that, when accumulated, affect efficiency.
The point is not to replace screens with other devices, but to understand when the current format is sufficient and when a different approach might be worth exploring. Each sector—and even each process within the same organization—may require different solutions.
5. The future of data visualization
The future of data visualization points toward more contextual, interactive, and intelligent models. The convergence of real-time data, advanced analytics, and more immersive interfaces opens the door to experiences where information accompanies action rather than interrupting it.
In the short term, many organizations will continue to rely on dashboards and traditional systems. In the medium and long term, we are likely to see a gradual evolution toward hybrid environments where multiple formats coexist.
At Blautic, from our experience in data projects, we understand that any innovation must be evaluated based on its real impact: does it improve understanding? Does it reduce errors? Does it optimize processes? Does it facilitate decision-making?
In this sense, augmented reality is not a technological fad, but a possibility that invites us to rethink how we interact with information. And in an increasingly complex business environment, that strategic reflection on visualization can make the difference between simply accumulating data and turning it into real knowledge.